Script Debugger
Overview
The Script Debugger can help narrow down which lines of code have issues or bugs by allowing creators to pause script execution and move specifically through different lines of Core Lua scripts.
A common way to debug a game to find issues or bugs, is to use the print function to print out values to the Event Log.
Opening the Script Debugger
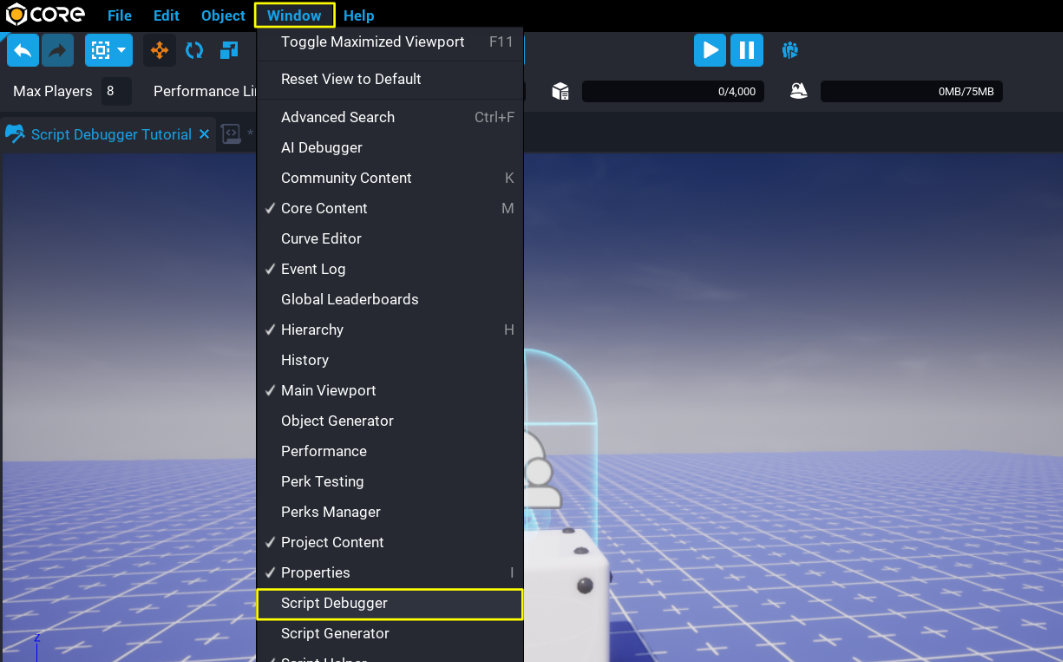
From the Window menu, select Script Debugger to open up the Script Debugger window.
Script Debugger and External Editors
The Script Debugger only works with the Script Editor in Core, and not external editors.
Enabling the Script Debugger
The Script Debugger needs to be enabled so that breakpoints added will pause the execution of the game. This allows areas of interest in a script to be inspected that may contain an issue.
Clicking on the  icon will enable the Script Debugger. When enabled, the icon will turn red
  , indicating that the Script Debugger is enabled. With the Script Debugger now enabled, any breakpoints added will pause execution of the game.
When disabling the Script Debugger, all breakpoints will also be disabled. This allows creators to disable all breakpoints without removing them. Next time the Script Debugger is enabled, the breakpoints will also be enabled.
Enabling Pause on Error
The Script Debugger has the option to automatically pause the game when an error has occurred. This can be useful to have enabled when scripts in a game are causing an error. Clicking on the  icon will change to red
  , indicating that the Script Debugger will pause on error.
Adding and Removing Breakpoints
A breakpoint is a way to mark a specific line in a script for debugging. More than one marker can be set in a script, but only one can be set for each line. Markers can be set by left clicking with the mouse in the far left margin of the Script Editor.
Adding a Breakpoint
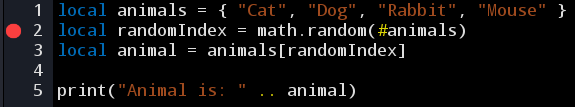
A breakpoint can be added so the Script Debugger knows where to pause execution. Adding a breakpoint can be done by left clicking with the mouse in the far left margin of the Script Editor. On clicking in the margin, a red circle will be added to the margin, indicating that line has a breakpoint.
Removing a Breakpoint
Removing a breakpoint works the same way as adding a breakpoint. Clicking on the red circle in the far left margin of Script Editor will remove the breakpoint. When the game is played, the Script Debugger will not pause execution if no breakpoints are present.
Stepping Through a Script
When script execution is paused, the Script Debugger can step through the script to examine line by line to inspect variables and objects to help find issues and bugs.
Step Into
Step Into ![]() can be used to step through a script line by line. If the line contains a function, the Script Debugger will enter that function and continue line by line.
can be used to step through a script line by line. If the line contains a function, the Script Debugger will enter that function and continue line by line.
Step Over
Step Over ![]() will execute as one complete step. For example, if the current line is a function, then stepping over that function will move to the next line instead of stepping through each line of that function.
will execute as one complete step. For example, if the current line is a function, then stepping over that function will move to the next line instead of stepping through each line of that function.
Step Out
Step Out ![]() is used to step out of a function. The Script Debugger will execute the current function, and pauses at the first line outside of that function.
is used to step out of a function. The Script Debugger will execute the current function, and pauses at the first line outside of that function.
For example, when part of a function needs to be debugged, stepping out will tell the Script Debugger to run the rest of that function.
Select a Running Script Task
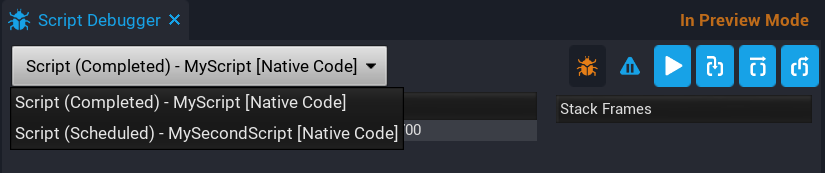
The Script Debugger will pause execution for any scripts that have breakpoints set. The Script Task dropdown lists all the scripts that are either running, scheduled, or completed. Only scripts that are running can be stepped through.
The Script Task drop down will list all the scripts, and also indicate which one is currently running, scheduled, and which have completed.
Script execution order in preview will not necessarily be the same for the public version of your game.
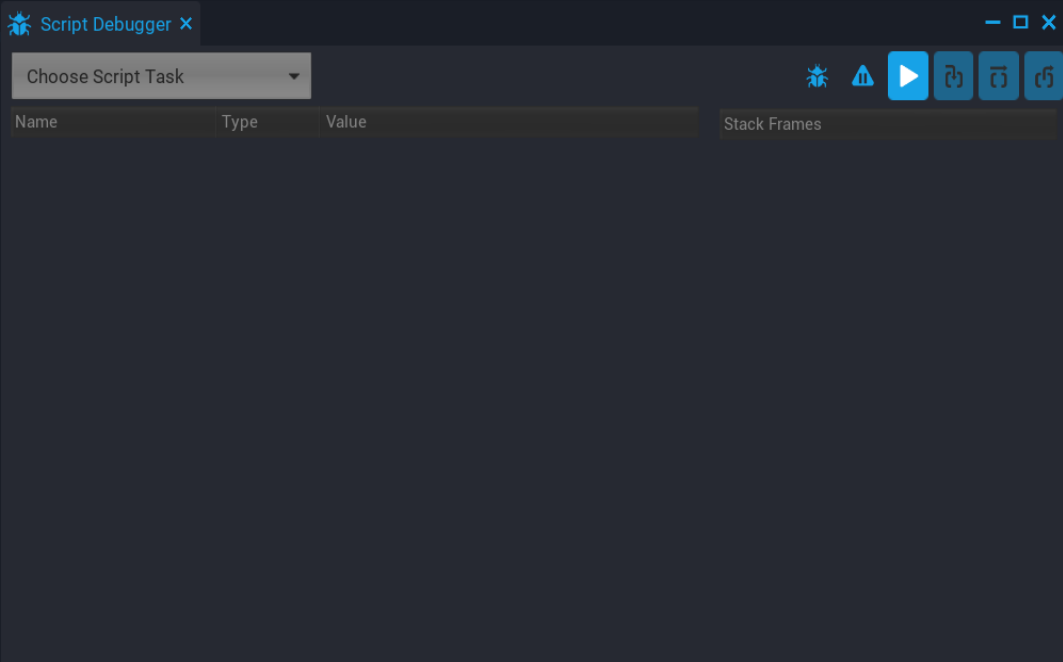
Stack Frames
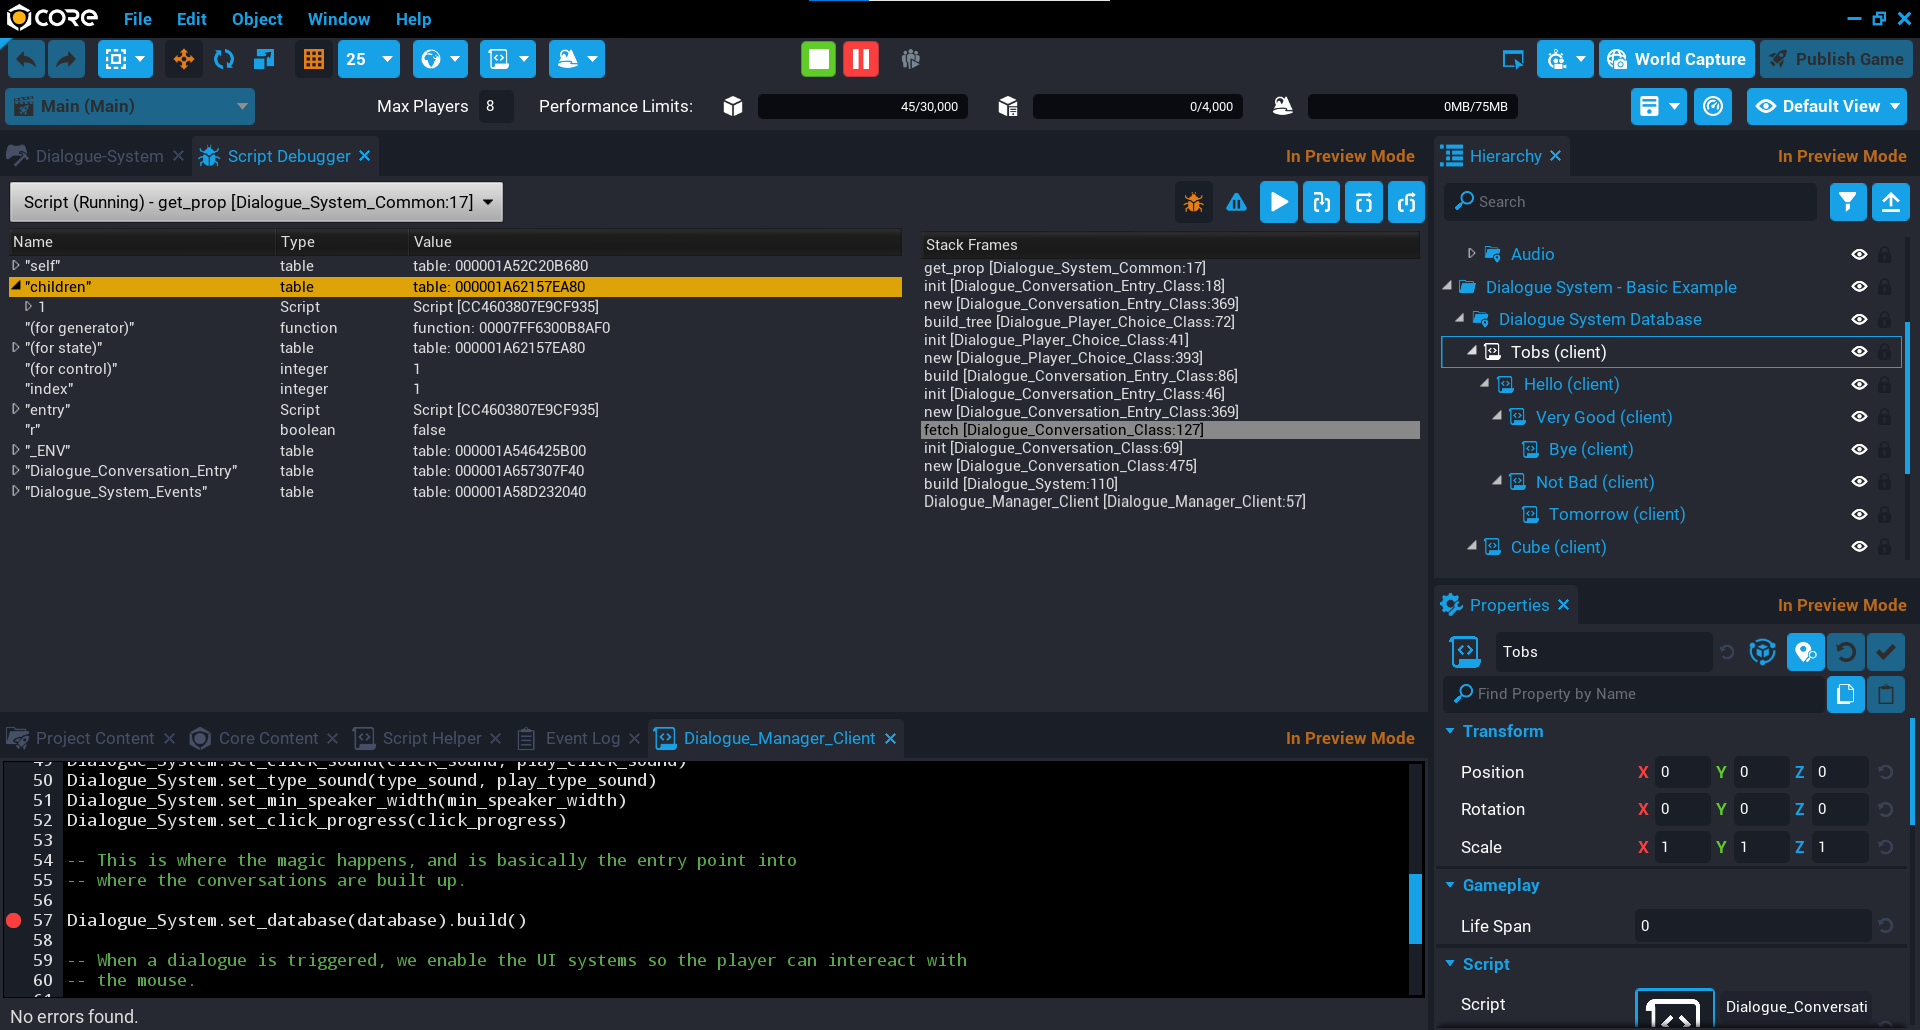
The Stack Frames panel in the Script Debugger window, shows the function calls that are currently on the stack for the current running script task. The Stack Frames panel shows the order in which the functions are getting called, which is a good way to see the execution flow of the script for the current task.
In the picture below, the execution flow for the current running script can be seen.
Learn More
Intro to Scripting | Lua Scripting Tutorial | Advanced Scripting in Core | Performance Window | AI Activity Tutorial